
Background
We recently began trying to measure OJIP, more succinctly known as “the transient rise in chlorophyll fluorescence,” on citrus plants. We immediately ran into values that did not make intrinsic sense, with large differences between Fo and O, and with traces that did not look like the characteristic sloped steps of OJIP analysis. We are using the Opti-Sciences OS-30p+ to collect data. We called the company, and their technicians were very helpful. They suggested that the modulated light power should be reduced. In order to do that we did not activate photosynthesis with our modulated (far-red light). They also recommended that we optimize the actinic light level. Because we could not find any published systematic approach to it we decided to try to go about it in a systematic way ourselves, and share the results with anybody who might be interested. It is interesting to note, that I had worked with OJIP of papaya for 3 years, and never noticed such problems. Thus, optimization may need to be species- and/or conditions-based.
Methods
We were used two (2) varieties of citrus (Murcott and Ruby Red) under two light levels: full sun and the Citrus Under Protection environment (approximately 20% shade). Leaves were selected randomly at approximately 2 to 3 meters from the ground. In the same row we put dark acclimation clips on leaves using one (1) leaf per tree. After one (1) hour of dark acclimation, we collected data for 8 different actinic light level from the lowest to the highest level: 525, 875, 1000, 2500, 3000, 3500, 4500, and 6000 µmol m-2 s-1 using the OS-30p+ fluorometer using the JIP protocol (Opti-Sciences, Hudson NH). This was performed only once.
Analysis
The results were subjected to principal component analysis, including only raw data: tFm, Fo, O, J, K, I, P, S, using prcomp from R stats and the factoextra package for visualization.
Results
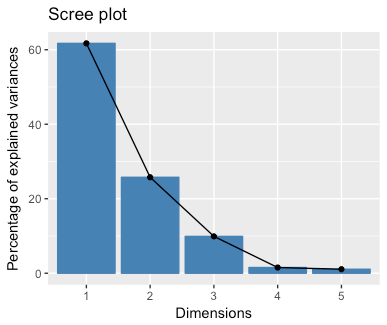
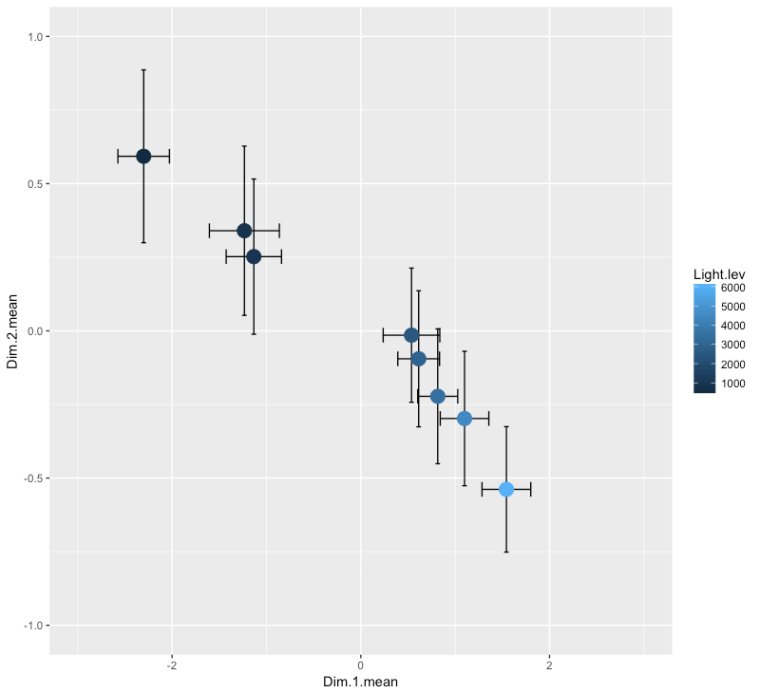
The raw data were simplified because K, Fo, and S were very positively correlated (redundant). Thus the final results include, tFm, O, J, I, and P. The first 2 principal components account for approximately 86% of the variance, and the third PC adds another 10% (Scree plot). tFm and O are negatively correlated on both the first and second PCs, and I and P add a different direction of effect.
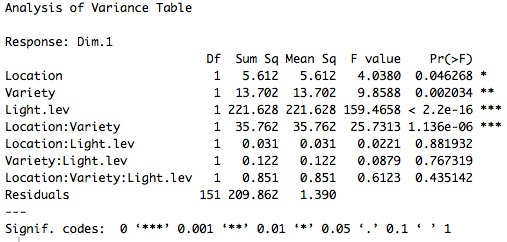
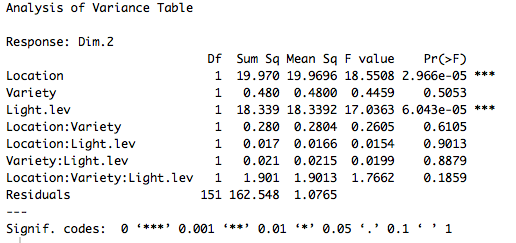
Actinic light level is the primary contributor to the variance in PC1, and a significant main effect on PC2, with no interactions with other factors (Anovas below). In theory This makes the actinic light part easy.
Ideally we would find an actinic light level that had confidence intervals that overlapped with zero in both directions, but no dice. The means for 1000 µmol m-2 s-1 and 2500 µmol m-2 s-1 are closest to 0 and upon visual inspection, you would think that somewhere around 1800 µmol m-2 s-1 would be very close to zero (Figure below).
Another point to consider is that initial problem including large differences between Fo and O. Light level also had a significant impact on this difference, but with an interaction with the other 2 factors. While it is normal to have some difference between Fo and O, and because Fo is measured in the “dark” and O immediately after turning on the actinic light, you would expect delta O (Fo-O) to be slightly negative, but certainly, not 200 different (Fm being around 900), as with 6000 µmol m-2 s-1. However, at 1000 µmol m-2 s-1 the value of delta O overlaps above 0, which would make me think that perhaps this is not quite enough light, while at 2500 µmol m-2 s-1 the different varieties and locations are distinguishable, which should not necessarily be the case, as Fm and O are different estimates of the same characteristic. Once again, neither 1000 nor 2500 µmol m-2 s-1 can be eliminated, while it appears that perhaps an intermediate light level could be more suited.
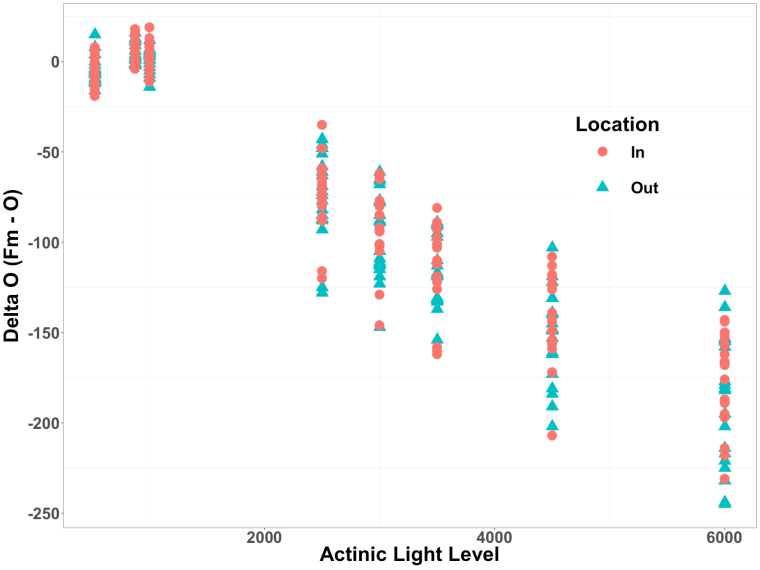
Still, delta O appears to respond toothed factors in addition to actinic light level (Analysis of variance results below).
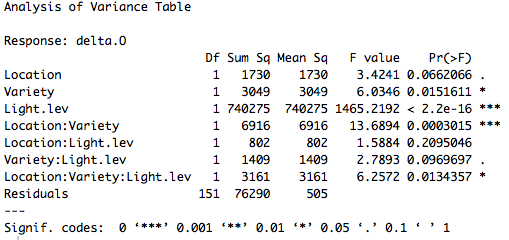
Thus a delta O below 0 is not necessarily a mistake. The only potential explanation for this that I have is that the rate of rise of the early part of the transient effects a higher O relative to Fo. If this is true Vj should be negatively correlated to delta O. I tested this with car.test in the basic R stats package, which uses a Pearson’s product-moment correlation and derives a p-value. The result was a correlation of -0.487, with 95% confidence interval of -0.567 to -0.399, and a p-value of <0.0001. My conclusion is that delta O is affected by light level but also by photochemical structure of the leaf, primarily in absorption-trapping.
The overall conclusion, however, is that actinic light level affects the results of the OJIP test. Although it is not entirely clear what the results should be, it seems that chlorophyll fluorometer companies could help us by including some actinic levels in the range of 1800 µmols m-2 sec-1. I would welcome any comment and would like to see a more systematic approach to OJIP analysis in generally. A discussion among those who use the test would likely lead to a more sound approach.
