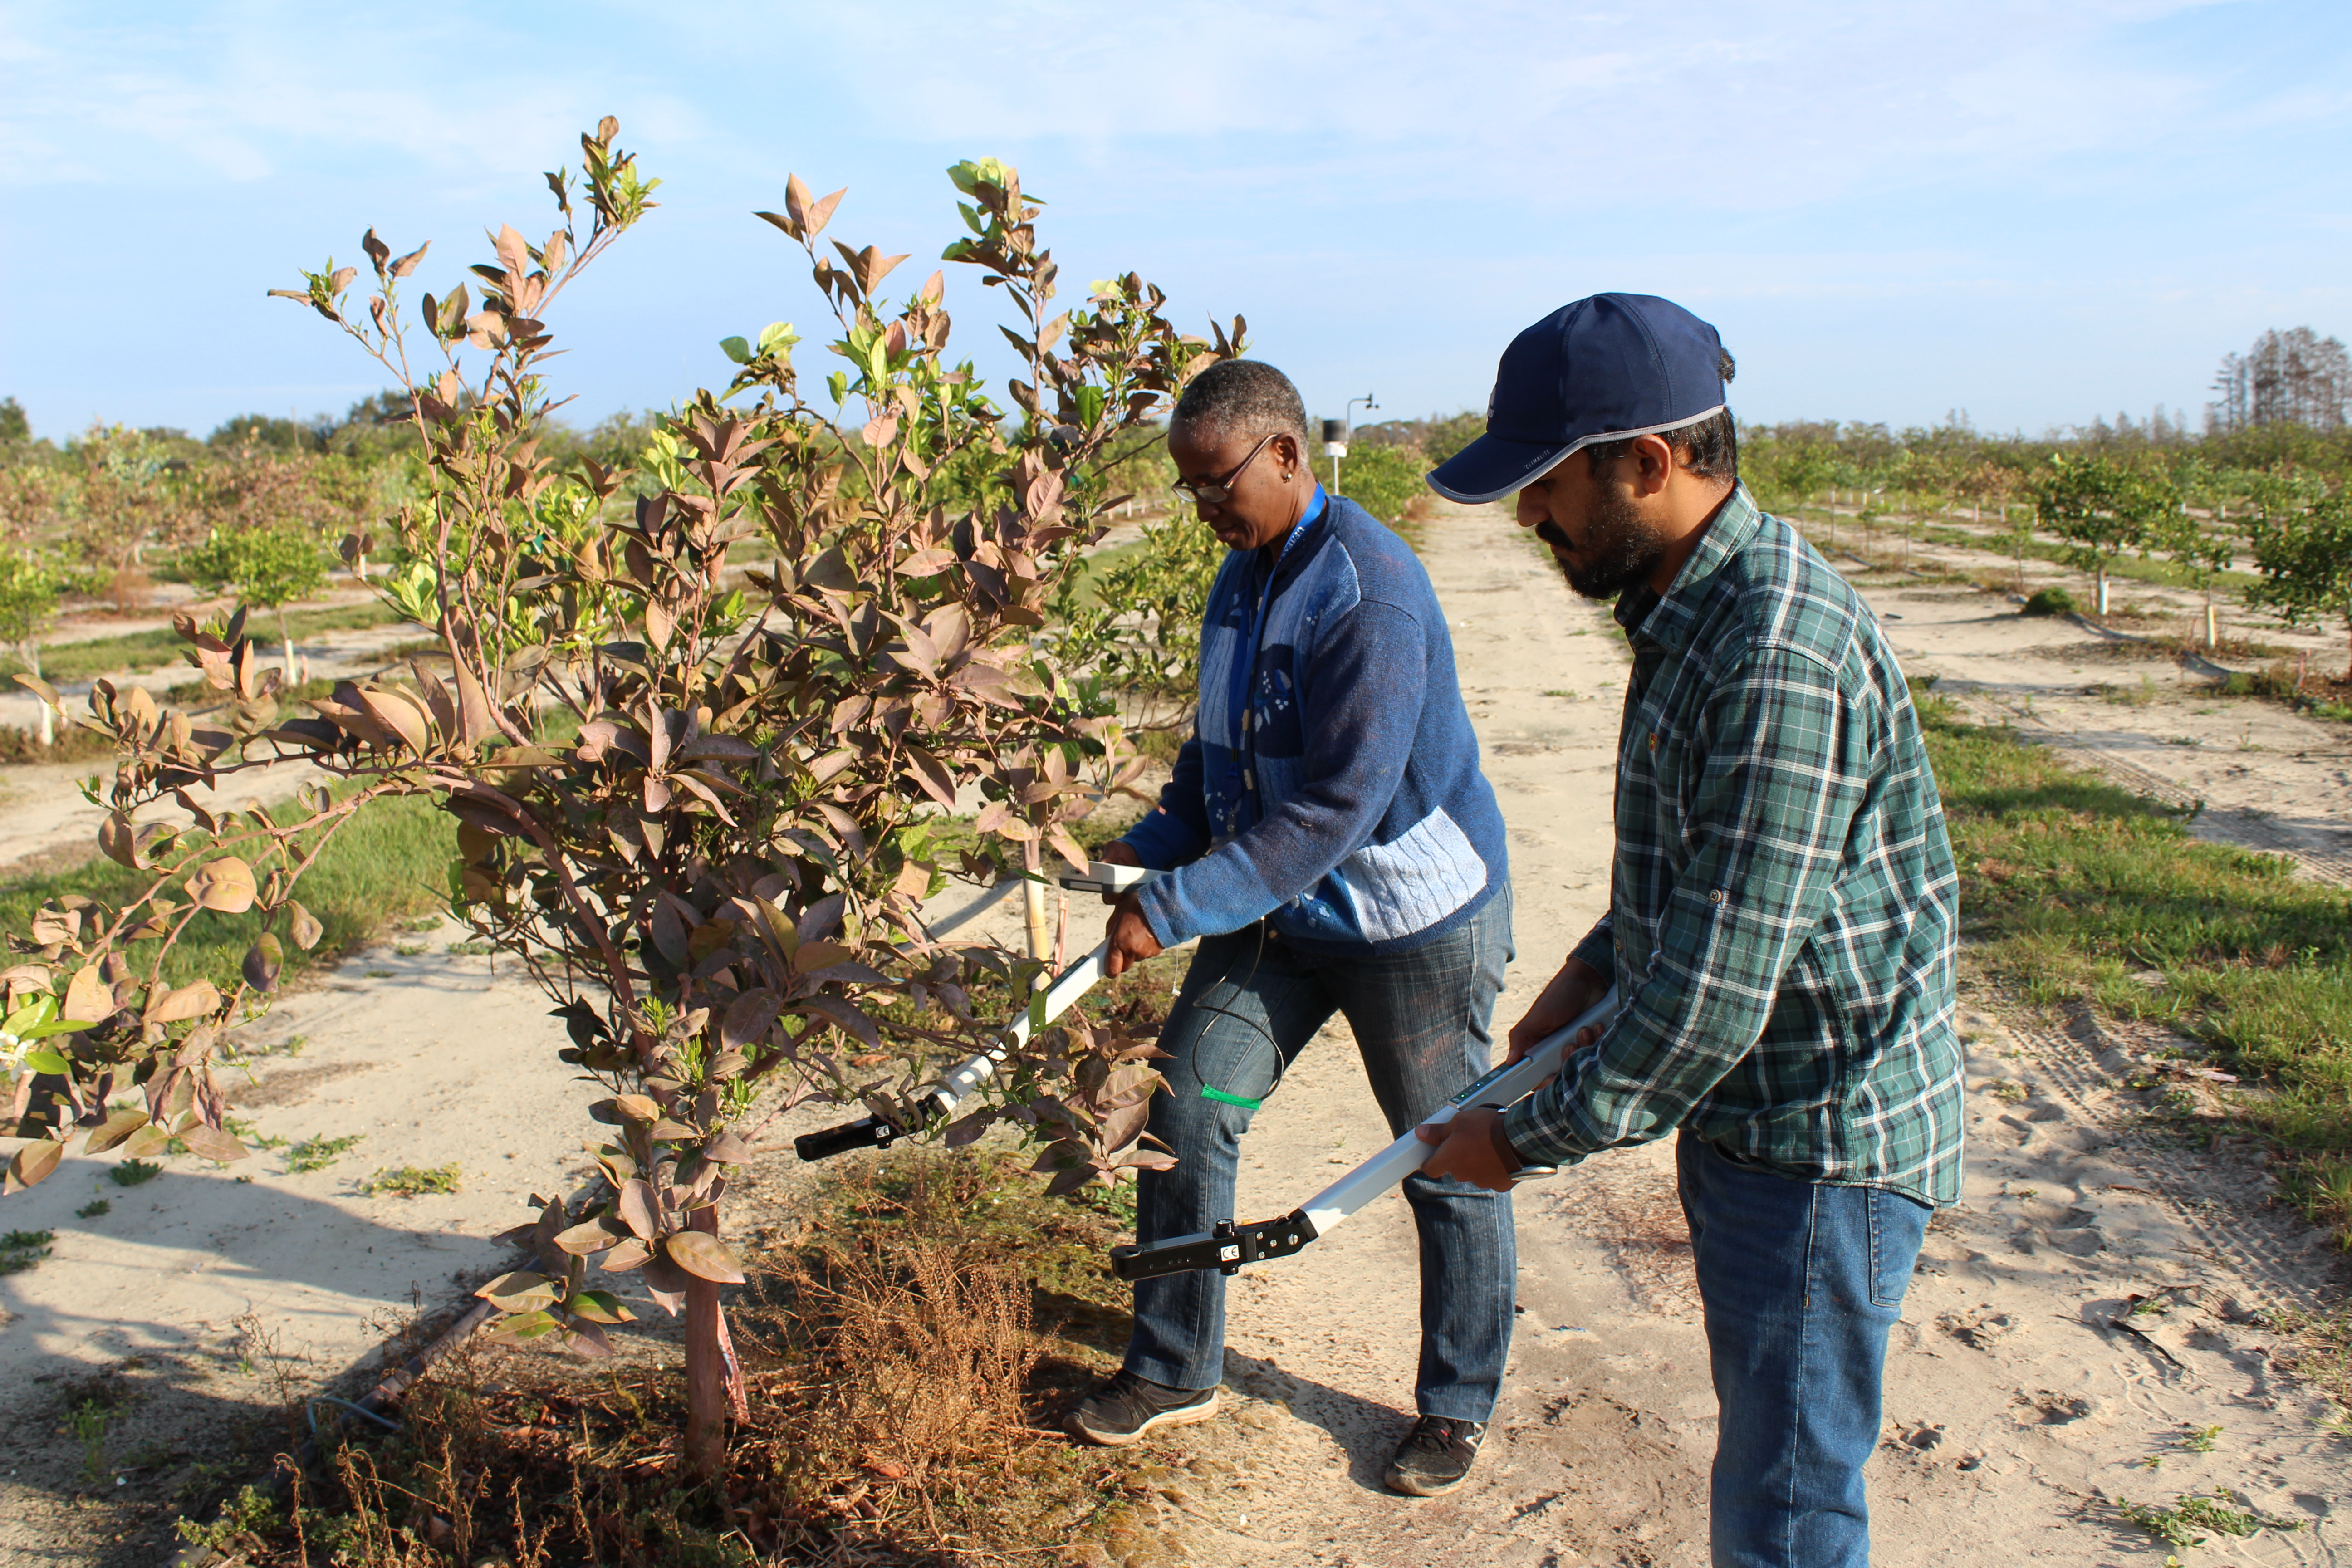
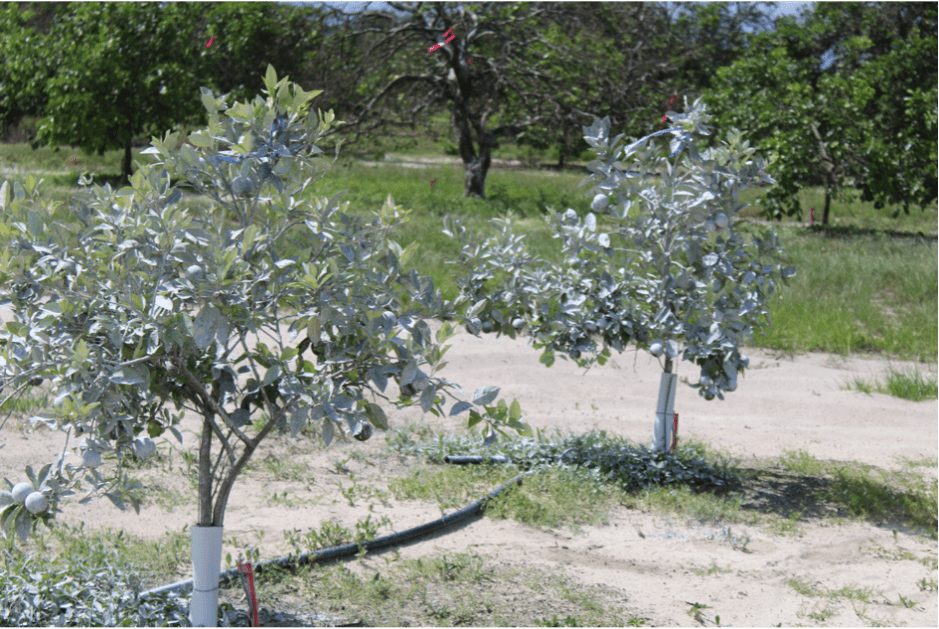
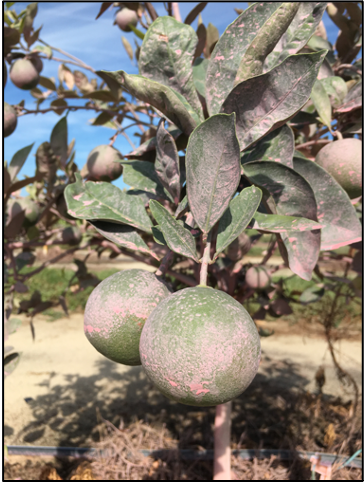
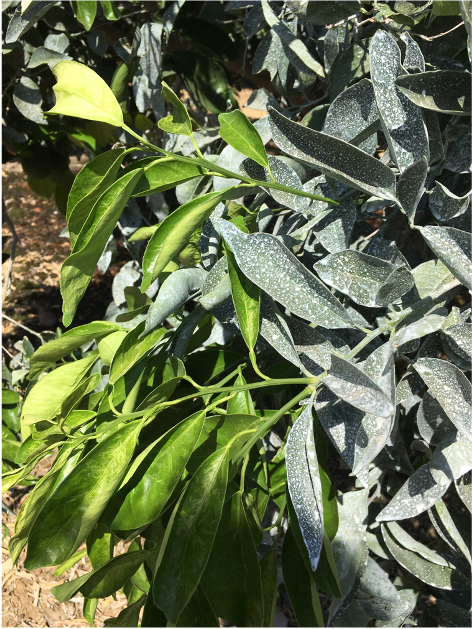
In our study kaolin particle films helped manage pests, and also improved tree growth. Kaolin particle films are a type of mineral that can be sprayed on plants to create a protective layer. Asian citrus psyllids, the pest that transmits citrus greening disease (HLB), are attracted to the natural color of leaves and the particle films cover this. White and red colored particle films were used in this study. Trees with white and red dye had a greater growth rate of trunk girth than controls, regardless of infection. This study found that particle films helped reduce the number of psyllids on leaves, as well as increased tree growth under HLB pressure.
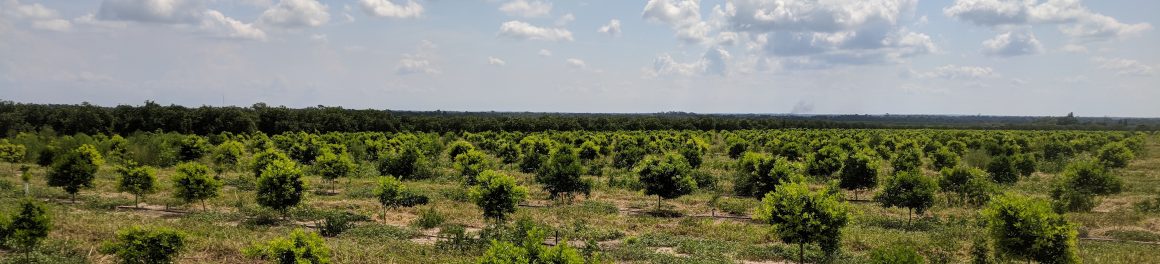
HLB is the current largest threat to the Florida citrus industry; citrus production has declined, and citrus trees are nearly all infected. HLB stunts tree growth and limits yield, especially if infection occurs when the trees are still small. We studied for three years whether kaolin particle films on newly planted trees could help manage psyllids. We also tracked tree growth response to particle films and HLB.
HLB reduces the growth rate of trees and negatively affects fruit yield and other quality characteristics. HLB cannot be cured once trees are infected so pest control is the usual course of action when it comes to preventing infection. HLB is spread when adult psyllids carry the bacterium from infected trees to uninfected trees. Kaolin particle films are a potential alternative to insecticides as a way to manage psyllids and the reduction in tree growth caused by HLB.
Increased growth in treated trees happened in spite of HLB infection. The positive impact of particle films on growth is likely due to shading, reducing photoinhibition, and light redistribution to lower canopy layers. Kaolin treatments increased growth enough that they made up for the loss in growth from infection. This is promising because it helps relieve pest pressure, while increasing growth of HLB affected trees.